The social media world has grown exponentially over the past few years, and more and more people have hopped onto the bandwagon. Today, it’s not just an identity or a way of communication but an entire industry.

There are over 4.76 billion social media users around the world. With the advent of accessible technology, the number is only expected to increase. Social media is no longer the luxury of only the young and the educated. It has become a source of information, entertainment, connections, marketing, and even a source of income for many.
Be it Facebook, Instagram, Twitter, or new age content bearers like TikTok, they have all managed to create a disruption in their own space and change the ways of the world. In fact, despite various bans, TikTok managed a cumulative growth rate of 100% in just 2 years from 2020, becoming the fastest-growing social media platform.
Read on to find out which platforms have donned the crowns and what the social media statistics and user trends look like.
Do you remember playing Farmville on Facebook? 😛 Now you may wonder who even uses Facebook anymore! But as the world’s digital population grows, social media reach, and usage has also seen a massive increase across all social media platforms. Let’s have a look at social media usage statistics.
- The total number of active social media users has seen a 3% year-on-year increase.
- With 2.96 billion monthly active users, Facebook is still the most widely used social media platform.
- With 2 billion active users, Instagram is the 4th ranked most active social media platform, only slightly behind WhatsApp.
- The second most used social media platform is Youtube, with 2.56 billion monthly active users
- Platforms like Twitter and Pinterest are far behind, with 556 and 445 million monthly active users respectively

We’ve already seen the massive size of social media. Now let’s have a look at usage. With more engaging forms of content, media forms, and increasing frequency, we’re giving more and more of our time to social media. We are looking at social media as replacements not just for our social life but also as our news sources, shopping portals, and more. Here are some social media usage statistics to give you a real picture.
- Worldwide, people spend 38% of their total available time on social media.
- A typical social media user generally spends almost 2.5 hours per day on social media.
- Internet users between the ages of 16 and 64 use an average of 7.2 social media platforms actively each month
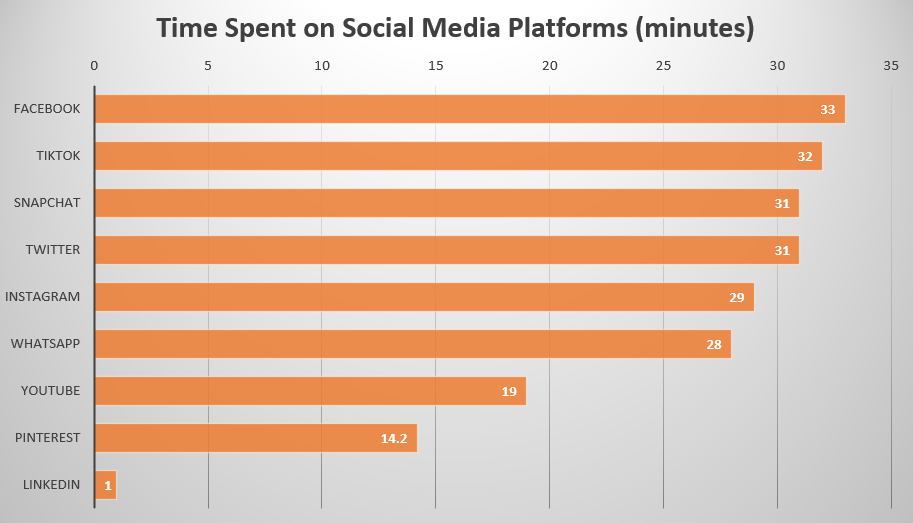
- Facebook ranks highest in terms of average daily time spent, with 33 minutes. The time spent on various platforms is shown below.

- LinkedIn is still struggling to find its place as a popular social media platform, with an average daily time spent of less than 1 minute.
- An average of 694,000 hours of videos are streamed by Youtube users each and every minute, which is more than even Netflix!
- Close to 47% of social media users are on the platforms to keep in touch with friends and family, while 30-35% use them to tackle boredom, read the news and look for content each
- Almost 26% of users are there to browse for products to buy, which isn’t surprising because global sales through social media platforms were an estimated $992 billion.
- Social commerce sales are expected to reach an estimated $2.9 trillion by 2026.

Engagement Rates
How do you determine your success on social media? Through metrics, of course! Reach, impressions, engagements are the bread and butter of any successful social media campaign. Let’s take a look at which social media platforms are winning this particular battle!
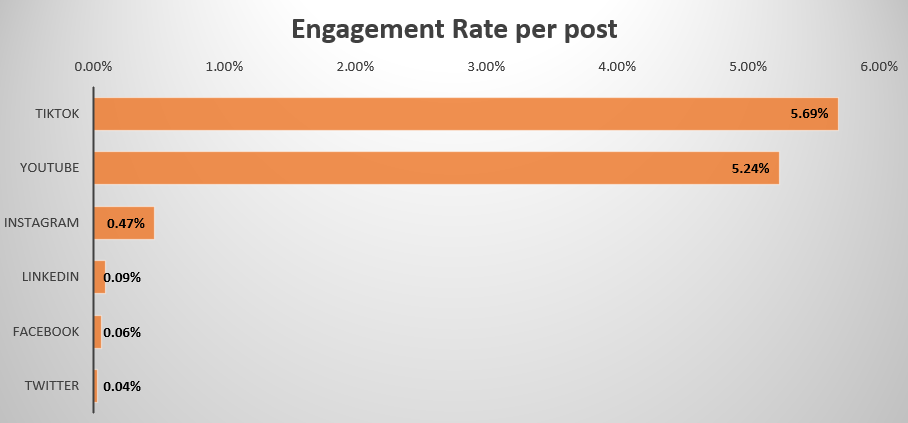
- TikTok topped the charts in 2023 with a whopping median engagement rate of 5.69%, followed by YouTube at 5.24%.
- The median engagement rate for both Facebook & Instagram declined this year, at 0.06% and 0.47% across all industries.

- Talking about average engagement rate, TikTok still tops the chart at 4.25% (calculated by followers) and 5.1% (calculated by views)
- Instagram has recorded an average rate of 0.6%, while Facebook has seen an average engagement rate of 0.15%.
Post Frequency
Facebook has a median of posts per week at 5.04 by industries, while Instagram has a slightly lower median at 4.6 posts per week.
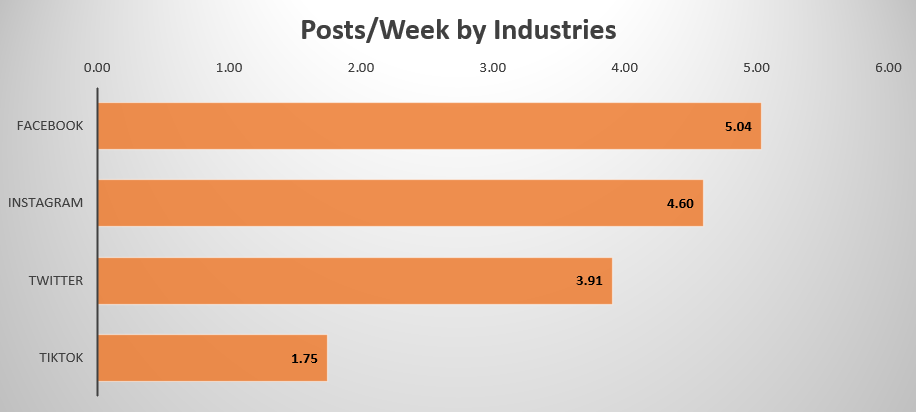
The median across all industries for Twitter is at 3.91 tweets per week, and TikTok garners a median of 1.75 videos per week (with the highest engagement, so content form matters a lot!)
- SimilarWeb has recorded Youtube as the social media platform with the highest number of visits at 33.6 billion in March 2023, followed (not so closely) by Facebook at 17.6 billion.
- Twitter saw 6.6 billion visits in March 2023, with Instagram catching up at 6.4 billion.
- According to a report by Edison Research, Facebook ranked the highest in brand awareness at 95% for the US population aged over 12.
- The same report ranked Instagram at 2nd with 91% brand awareness, with TikTok at 88%, Twitter at 87%, Snapchat at 84%, Pinterest at 71%, and LinkedIn at 64%.
- 42% of social media users believe that TikTok will deliver the best ROI in 2023, and 34% of users believe it to be Instagram reels.
User Demographics
Marketing has taught us that all customers are not the same, which is why our marketing messages need to be targeted and customized to people of different ages, genders, nationalities, etc. It is important to know who is present on which platform and what would be the best choice for your business.
Here are some important social media demographics statistics that will help you make better decisions about social media marketing.
- The worldwide gender split for social media users is 53.7% in favor of males.
- Facebook sees its highest number of users worldwide from people between the ages 25-34 at 29.9%, as of January 2023.
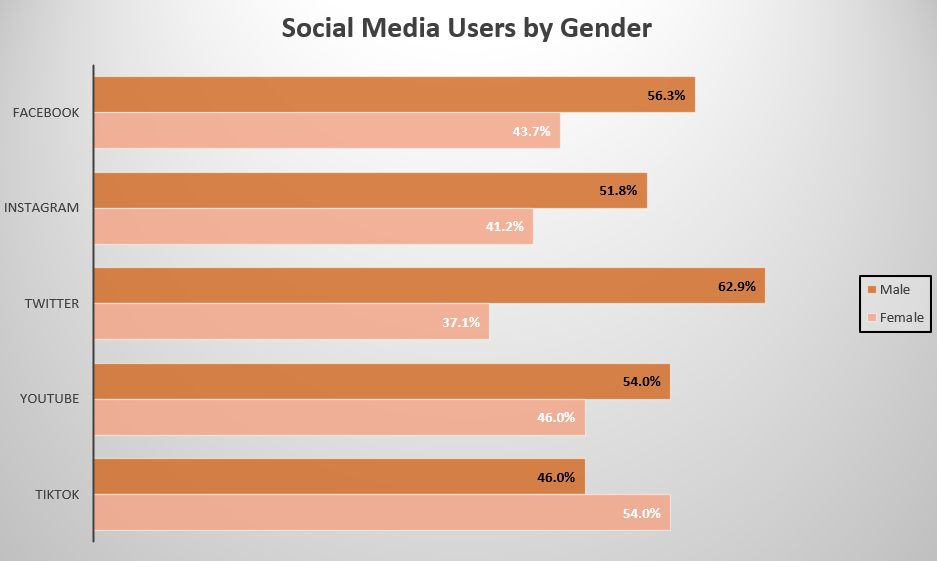
- Close to 43% of Facebook’s total user base is female.
- A total of 30.8% of Instagram users are between the ages of 18-24, and close to 17% of the total users are men in this age range.
- Twitter users see a gender split of 62.9% and 37.1% in favor of males (the largest gender gap for any social media platform!)
- 54% of Youtube users are male as of January 2023.
- TikTok has more female users (54%).

- Indians spend the highest percentage of time on social media, which is 44.4% of their total available time.
- The highest number of active Instagram users is also from India at 229 million followers, followed by the united states at 143 million.
- Demographics are an essential variable in understanding who is present and where. Internet users aged between 16 and 24 are more likely to use Instagram, with the popularity of Tiktok increasing for this age segment.
- Users between the ages of 55-64, on the other hand, are most likely to spend their time on WhatsApp.

Social media ads are no longer a new thing. Any successful marketing strategy is incomplete without a good mix of social media, and here are some interesting social media advertising statistics.
- Statistics show $226 billion spent on social media advertising annually, as on January 2023, with a 23.2% year-on-year increase.
- There are 4 billion advertisers using Facebook stories ads every month.
- By 2024, Instagram’s ad revenue per user will be $42, while the same for Facebook will be $36.
- Facebook has an average cost-per-click of $0.97, Instagram of $3.56, and the highest being that of LinkedIn at $5.26.
- The average cost-per-mille for Facebook is $7.19 per 1000 impressions. Instagram demands slightly more at $7.91, while Pinterest is the most expensive at $30.
- Facebook has the highest potential ad reach out of all social media platforms – 1.98 billion – which is why you cannot skip this particular channel while planning your next campaign!
- Platforms like Instagram and Tiktok are also in the running for successful ad channels with a potential ad reach of 1.32 and 1.05 billion, respectively.
Influencer Marketing
Influencer marketing was a huge trend-shifter in the world of social media. It gave rise to a whole new kind of content and allowed people to really harness the power of monetizing social media. It helped marketers and people across industries tap into a new source of marketing and revenue and give things a whole new color.
Let’s take a look at some important social media statistics regarding influencer marketing.
- Influencer marketing spend in the US is expected to reach $4.6 billion in 2023.
- 87% marketers and 90% content creators plan to increase their presence on Instagram.
- 68% marketers plan to leverage the potential of TikTok, while Snapchat rates the lowest on the priority list for influencer marketing, with just 4%.
- 45% of the total number of paid collaborations have taken place on TikTok, with Instagram coming in a close second at 39%.
- The popularity of video content is increasing by the year, which definitely explains YouTube’s average engagement rate of 50% against other video platforms.
- This also leads to Youtube having the highest influencer prices at an average price of $418.
- Fashion and beauty have seen the highest percentage (25%) of content across all platforms.

Additional Stats
Now that we’ve covered the essentials of our social media statistics and trends, another very important detail that marketers tend to forget is making your content pan-device friendly.
Statistics show that 91% of Internet users use their smartphones to access the Internet. 65.6% use their laptops or desktops, and 27.3% use their tablets. Consumer behavior differs for users on different platforms, and marketers need to be mindful of that.
For instance, YouTube users visit an average of 4.63 pages on the YouTube app against an average of 2.84 pages via a desktop, laptop, etc. In this era, unless you make your content for all types of devices, you will miss out on a lot of potential audiences!
Final Words
We hope you had as much fun reading this article as we did writing it!
We have collated the statistics that will give you an idea of the social media landscape of today. With changes in technology, demographic patterns, and reduced attention spans, these statistics may change drastically every year.
What was at the top this year may not even be present on the scene a couple of years later. This is why marketers need to be mindful of the changing trends in social media to be able to fully leverage the kind of potential this channel holds and shine with their marketing efforts.
Keep these statistics handy for your next marketing campaign. 🙋♀️